- Products
- Products
- TOP / Products

ViewTool(KAI Analysis Tool) for Semiconductor Analysis Now Available
KAI Analysis System
High-speed analysis of large-scale semiconductor device test data to support quality improvement, anomaly detection, and yield improvement
Key Features
High Speed
Processes large volumes of data with practical performance.
Scalability
Modules and functions can be added easily.
Security
Supports license management, authentication, and access control.
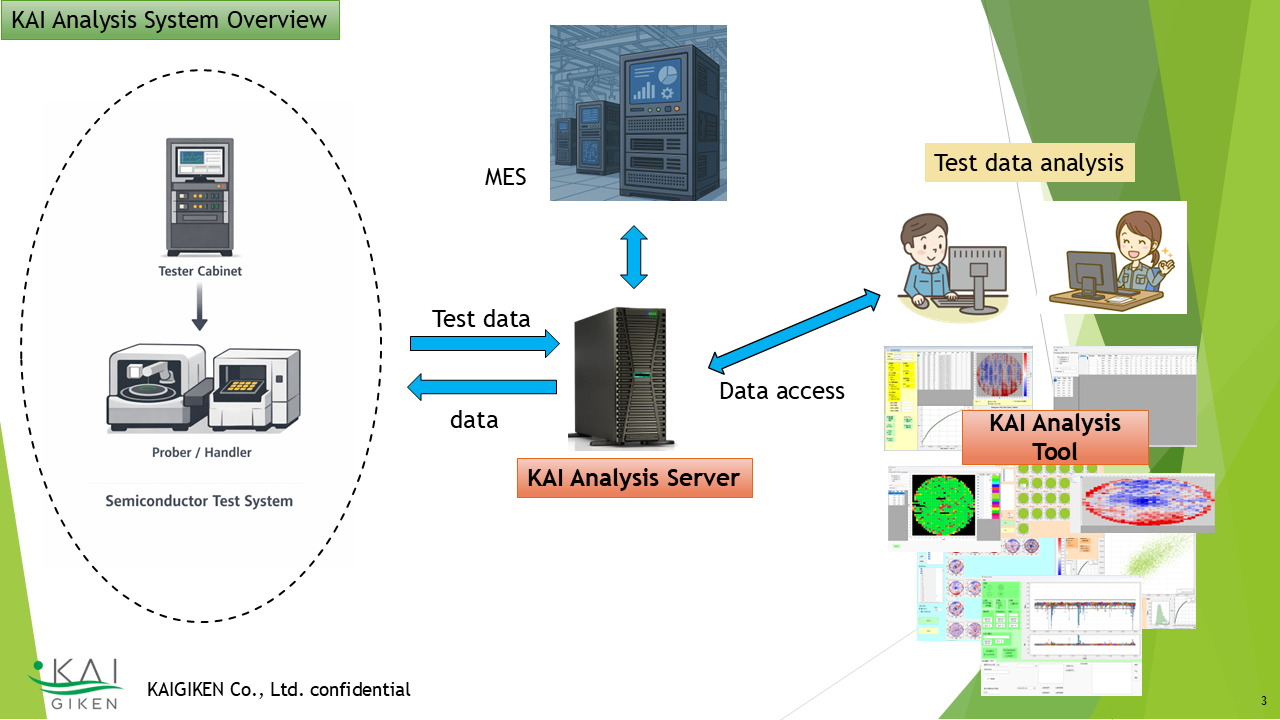
System Configuration
The KAI Analysis System consists of KAI Server and KAI Analysis Tool.
KAI Server mainly receives test data sequentially from testers and registers it in an internal
database.
KAI Server analyzes data to detect tester measurement anomalies and failures, product characteristic
abnormalities, and equipment abnormalities at an early stage.
KAI Analysis Tool connects to the KAI Server database and performs various test data analyses.

Use Cases
Click here for product and license information
Go to Product Page ↗Detailed Description of the KAI Analysis System
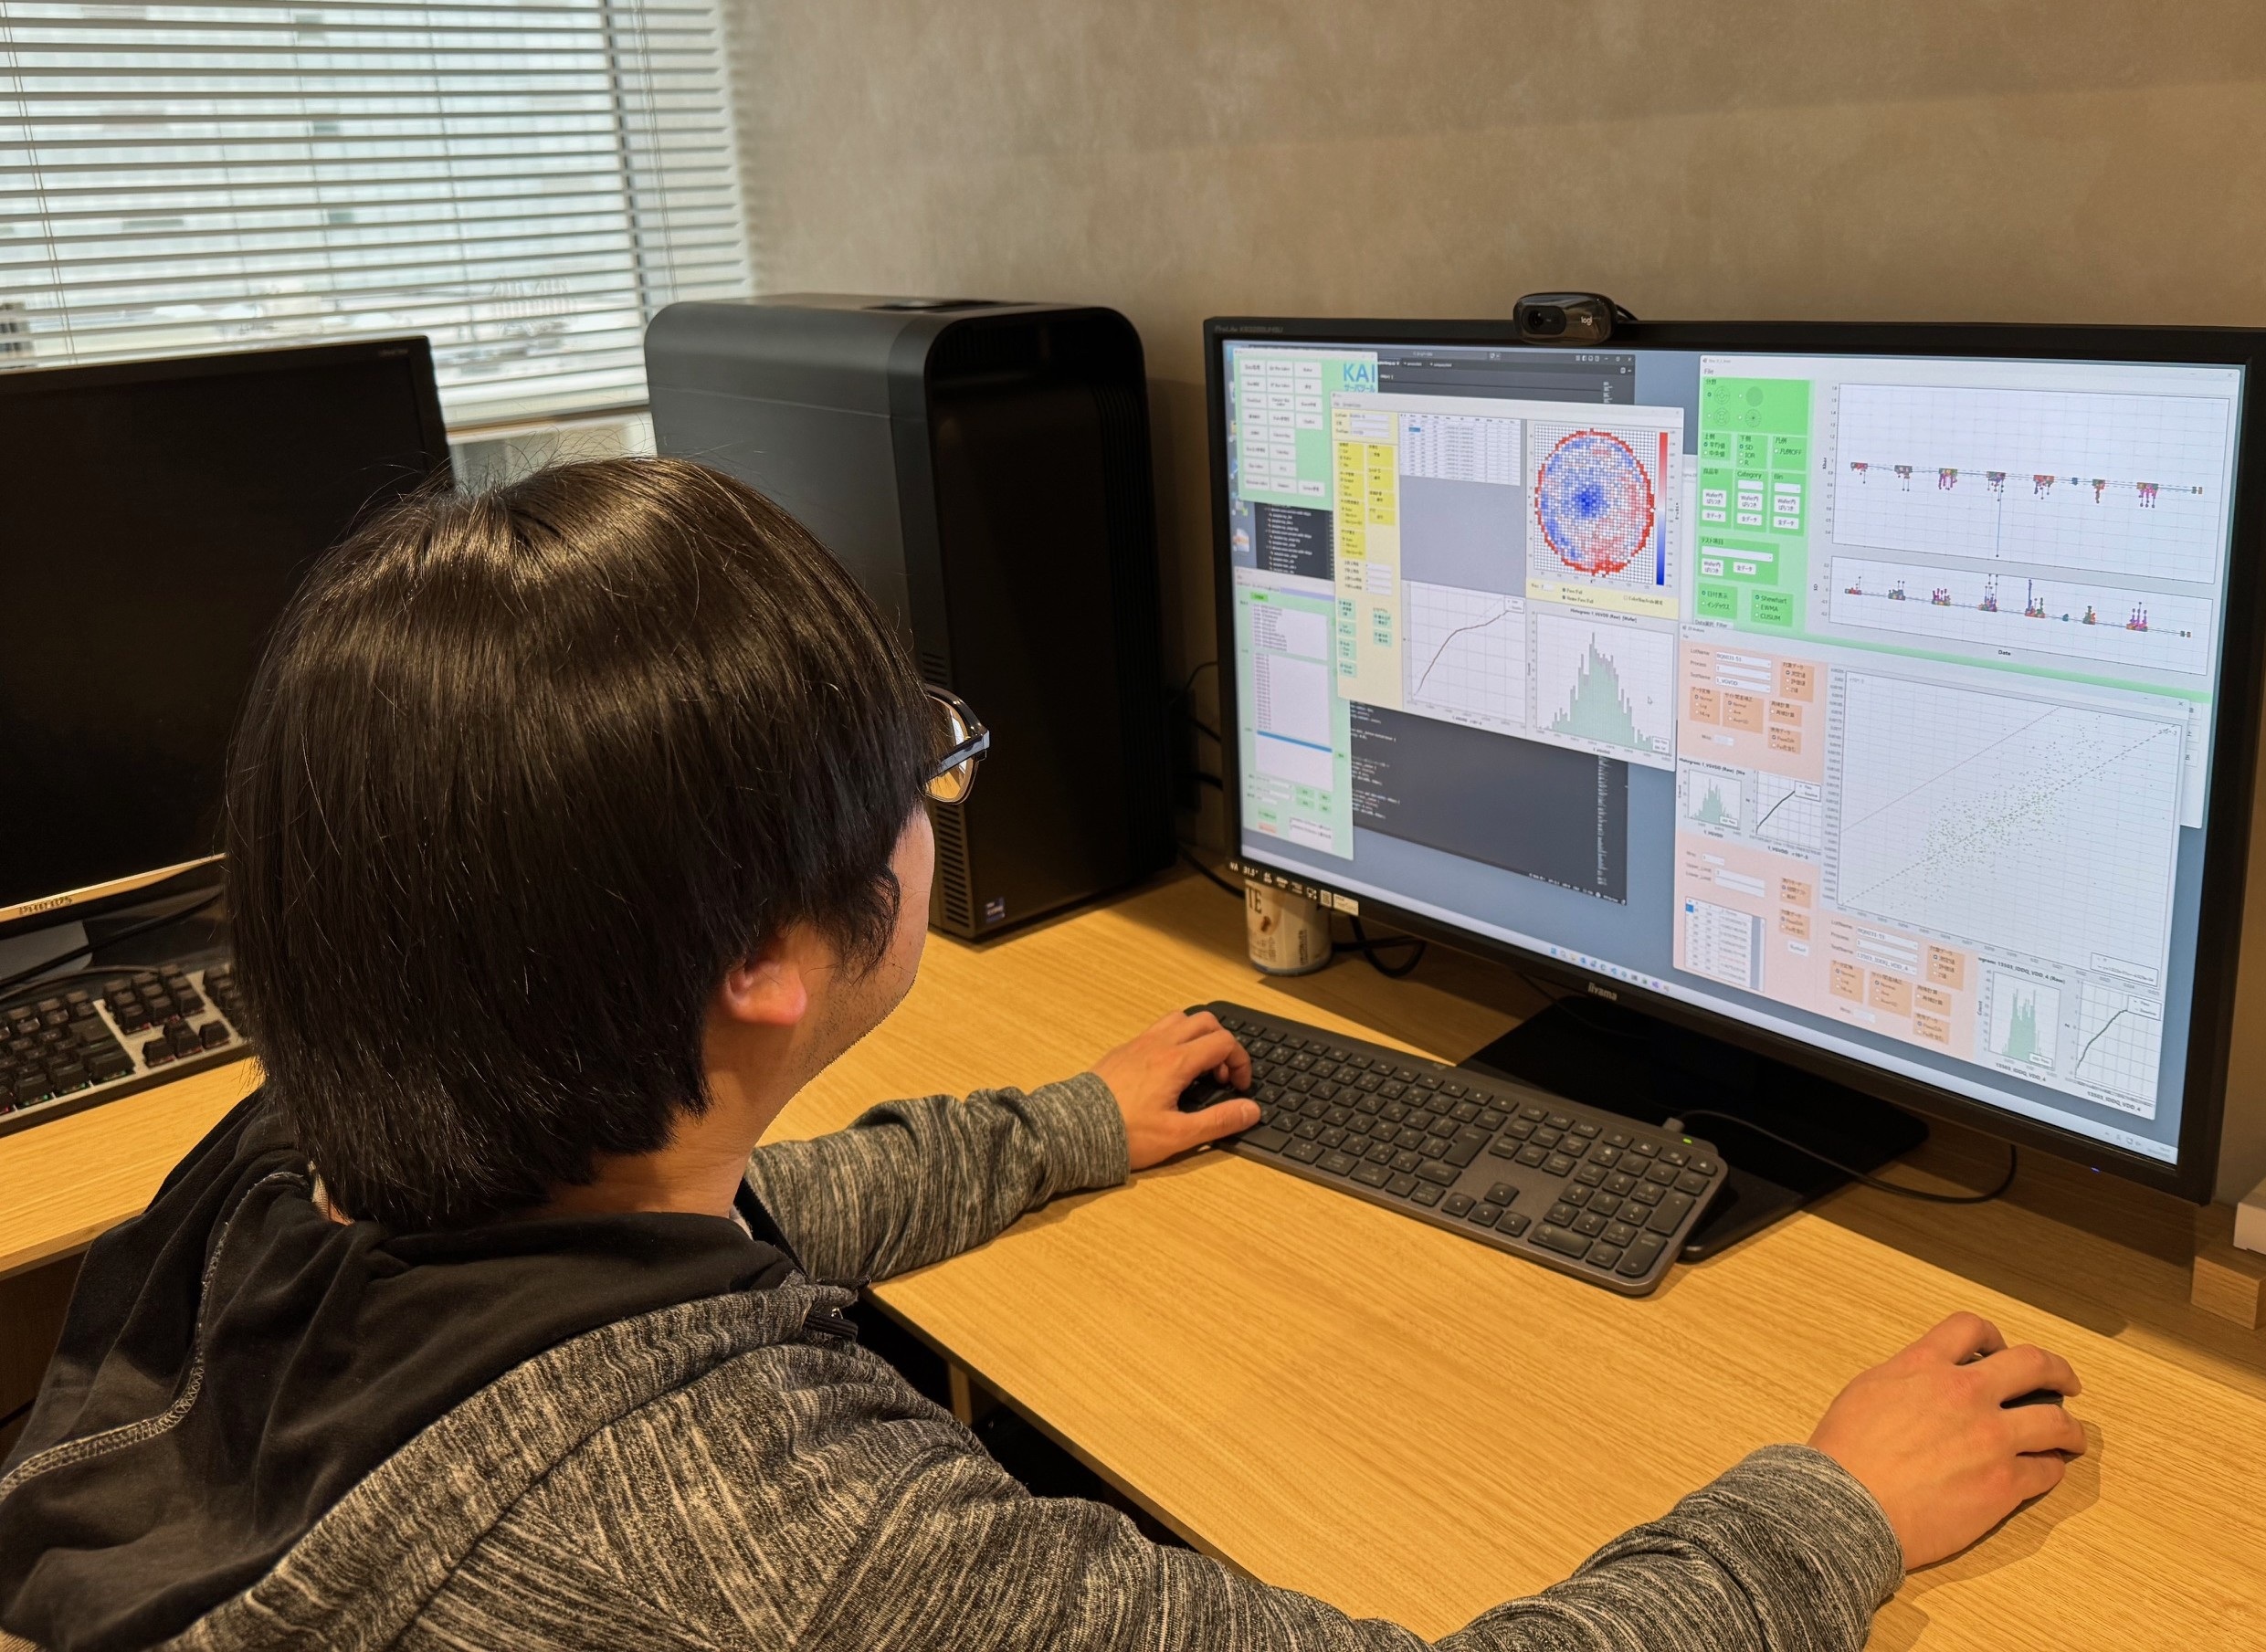
KAI_Analysis_Tool_Client is a PC-based tool for analyzing test data. The purpose of this tool is to analyze test data to achieve the following.
- Improvement of product quality
- Yield improvement
- Early detection of manufacturing anomalies
- Reduction of manufacturing and test costs
Deployment Model
KAI_Analysis_Tool_Client is operated together with KAI_Analysis_Server_System. KAI Analysis Server connects to testers and upstream systems, receives test data and metadata, and writes them to an internal database. KAI_Analysis_Tool_Client reads data from the KAI_Analysis_Server database and performs various types of analysis.
By connecting to the KAI_Analysis_Server database, KAI_Analysis_Tool_Client can handle large volumes of data. It can also read and analyze test data files such as STDF independently without accessing the database. However, in that case, analyses that require time-series data, such as state transition analysis, or analyses that identify patterns from large volumes of data become difficult.
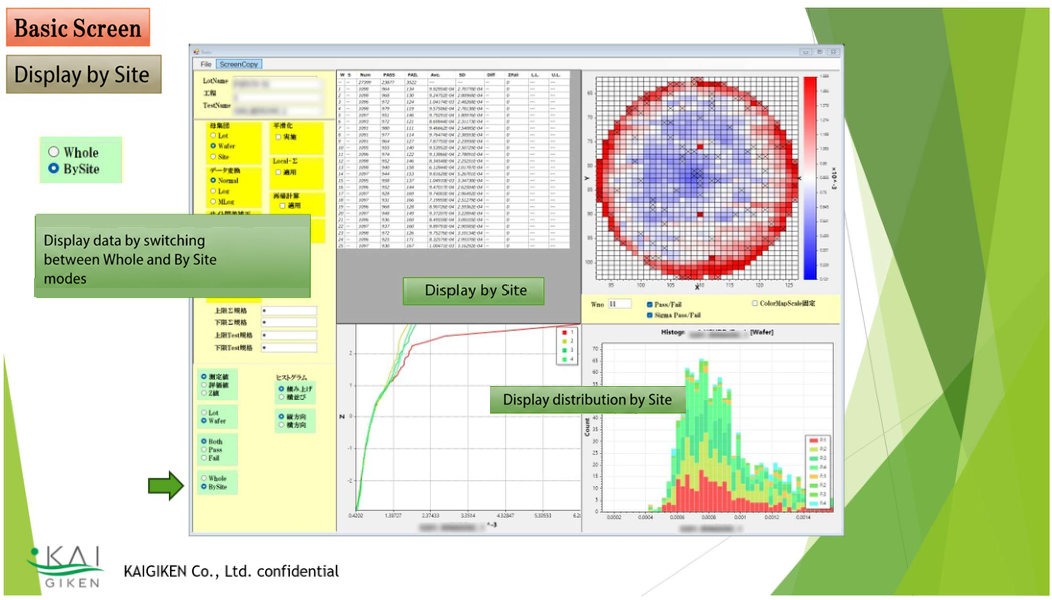
1Basic Statistical Analysis
Analyzes the distribution of parametric data by lot and wafer, wafer surface distribution (heat map), calculation of statistics, and data processing.
It also supports analyses such as outlier detection and defect classification based on test data distributions.
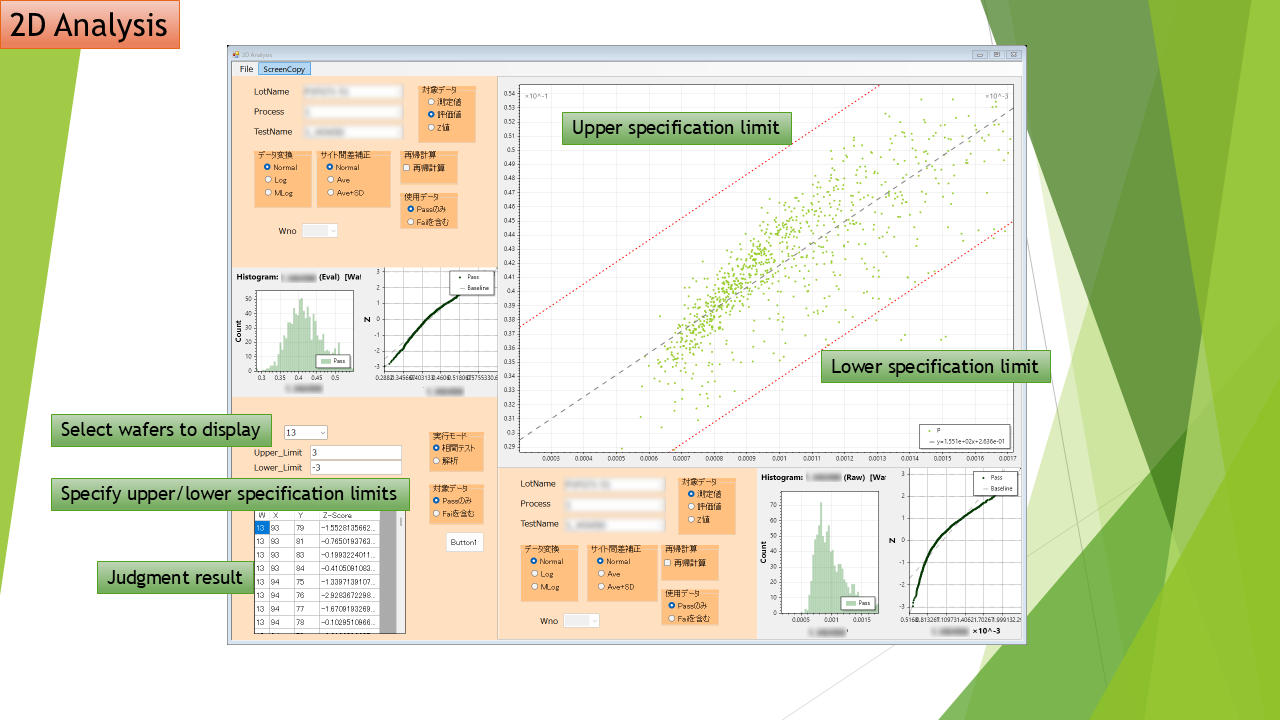
2Correlation Analysis
Analyzes correlations among parametric test data. Data points (devices/chips) that deviate from correlations can also be classified as outliers or defects. Correlations can be analyzed not only within the same wafer, even across processes, but also between wafers and between lots for various analysis purposes.
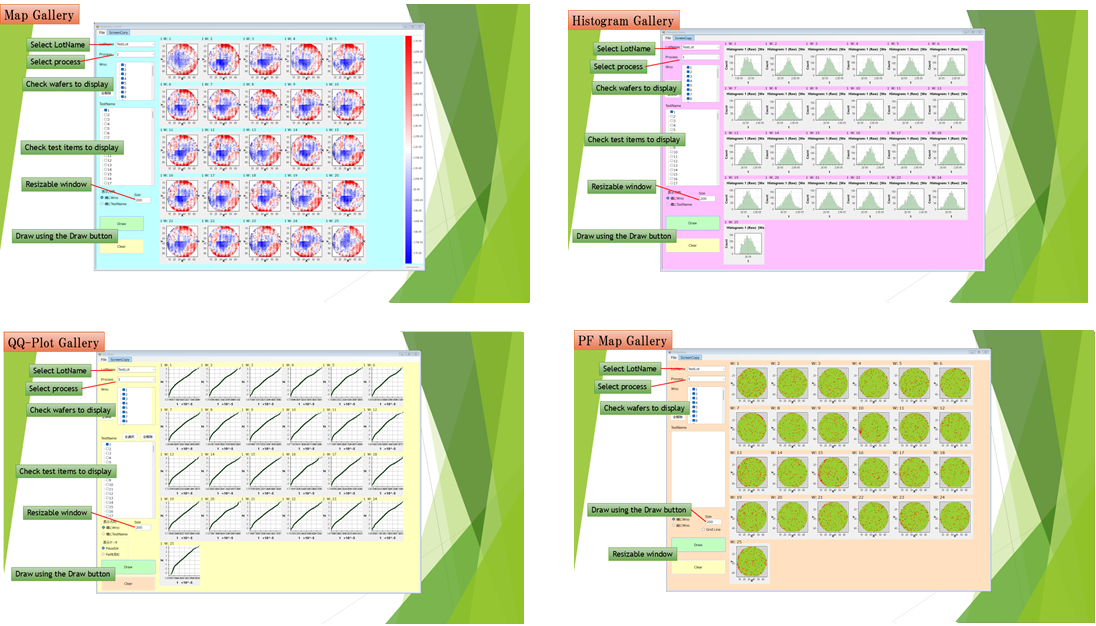
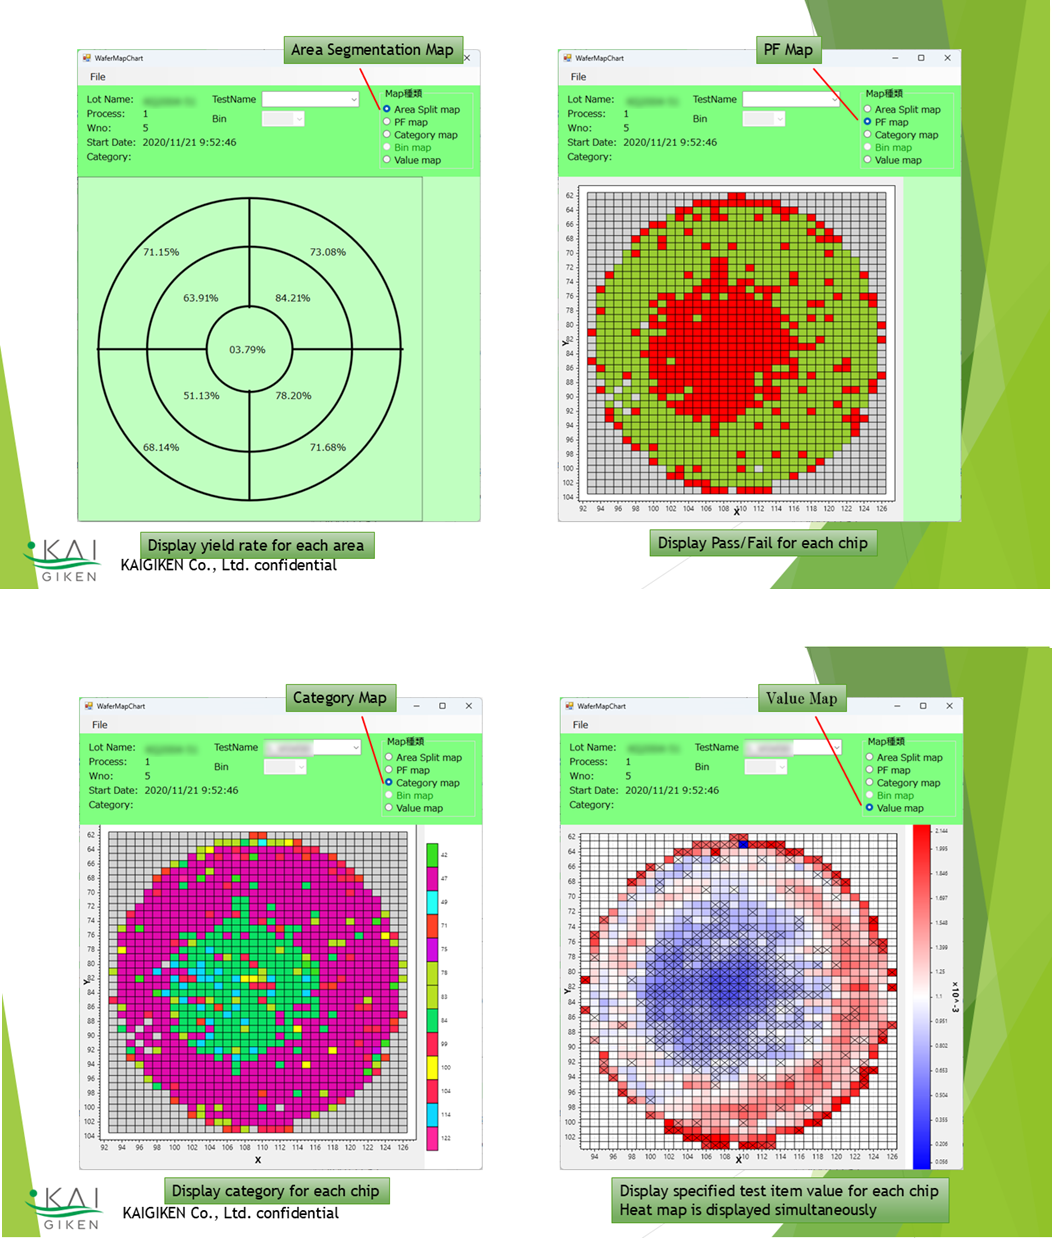
3Various Views
Wafer maps (heat maps), pass/fail maps, histograms, QQ plots, category maps, and list views can be displayed, making it easy to notice anomalies immediately when they occur.
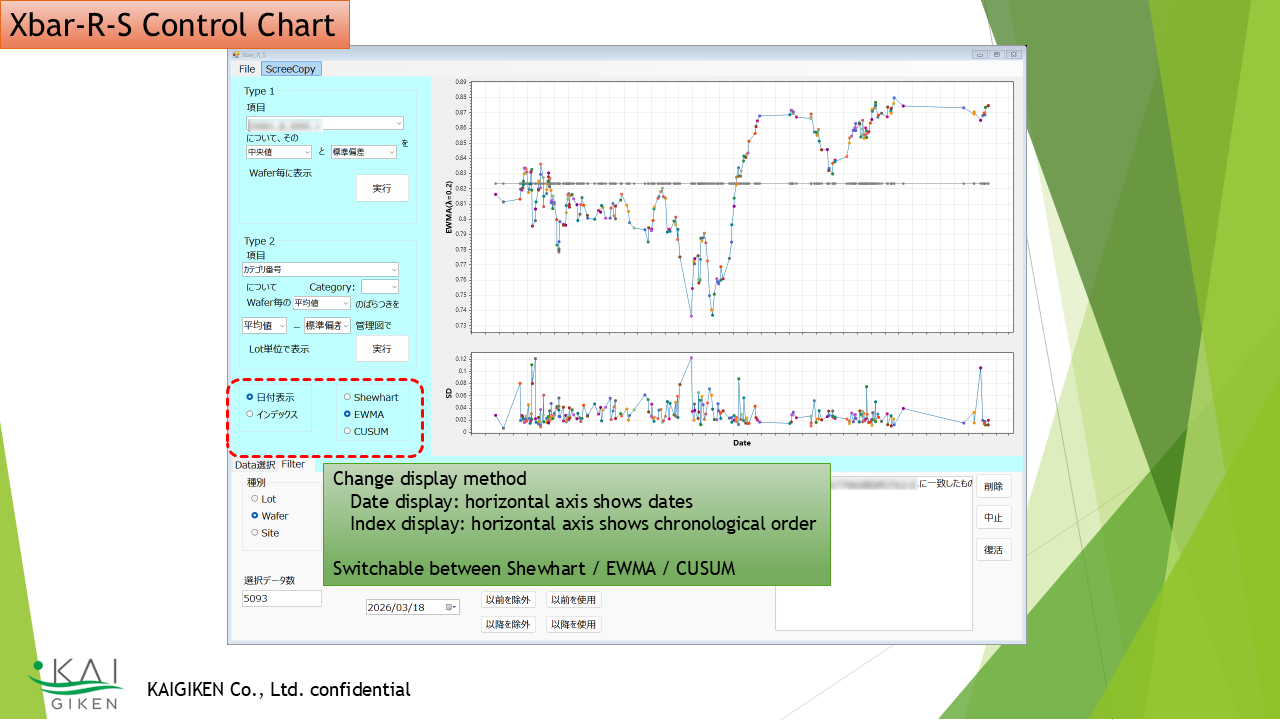
4Control Charts
Anomalies can be detected using Xbar-R/S control charts for statistics and parametric data. EWMA and CUSUM analyses are also supported.
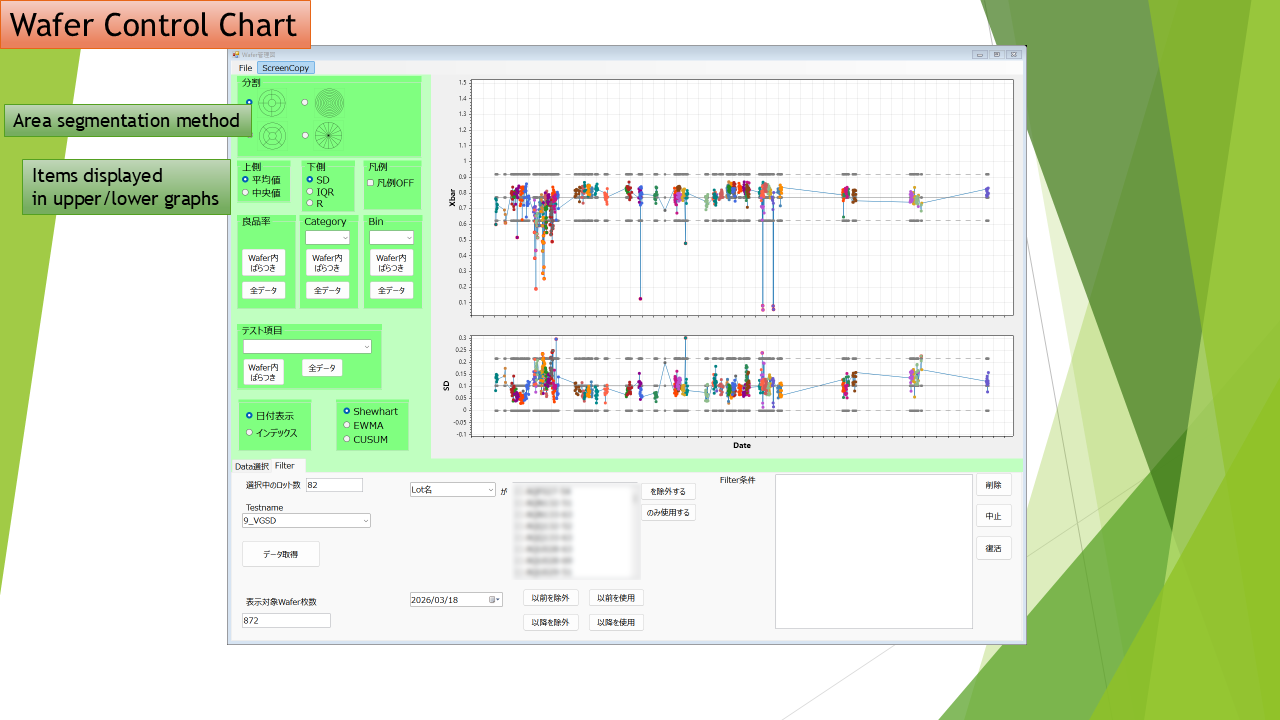
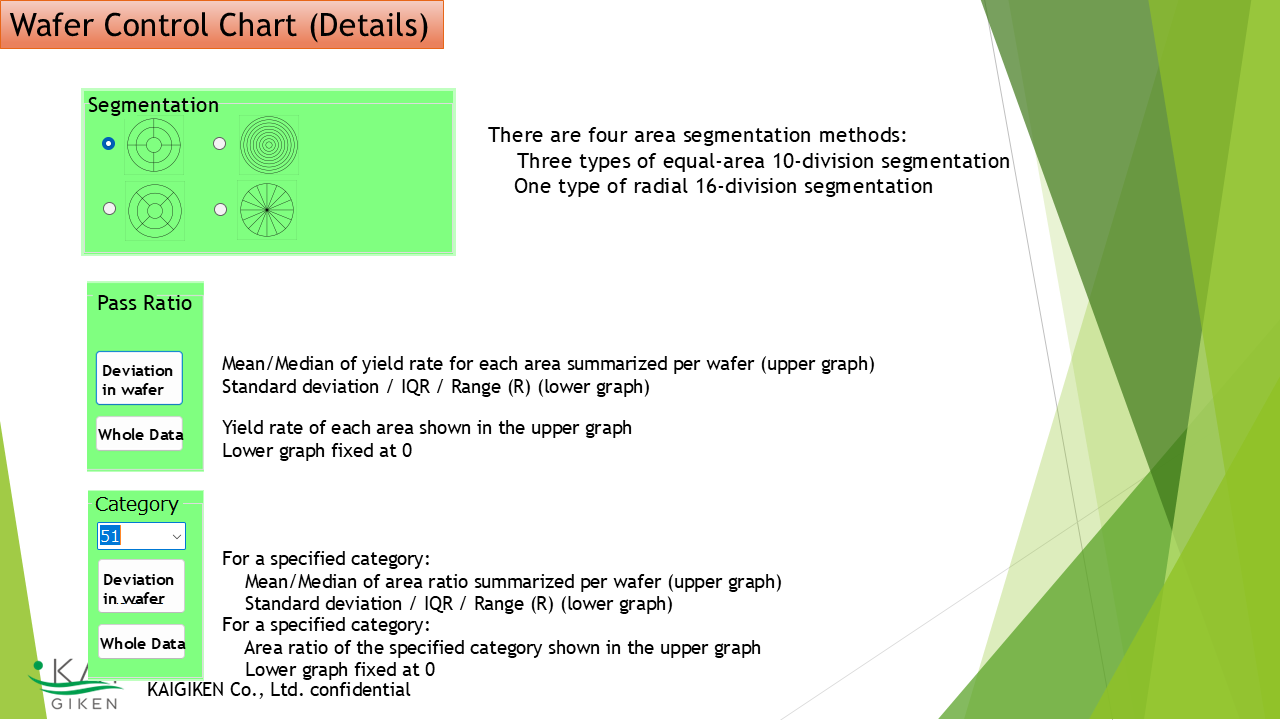
5Region-Segmented Control Charts
The wafer area can be divided into regions (10 or 16 segments), and statistics are calculated for each region. By analyzing these values with control charts, anomalies can be detected early.
There are four region-division methods. Target data include yield rate, defect category rate, and parametric statistics such as mean, median, IQR, and SD.
Display Examples
Examples of region-segmented maps, PF maps, category maps, and numerical maps.
Click here for product and license information
Go to Product Page ↗